> ## Documentation Index
> Fetch the complete documentation index at: https://docs-xcor.paloaltonetworks.com/llms.txt
> Use this file to discover all available pages before exploring further.
# Query limits
> Learn about query limits in Cortex XCOR, what happens when you hit limits, and how to avoid hitting limits.
Query resources are finite in any given system. Resource demand grows based on
factors such as the source of, and the amount of data the query retrieves.
Any very large query can request enough resources at either the database or browser
level that it leaves few resources for other queries, causing them to time out waiting
for resources to become available.
Palo Alto Networks Cortex XCOR employs several query limits at both the
[browser level](#query-truncation-at-the-browser) and the
[database level](#query-protections-in-the-database) to ensure a consistent user
experience across the system in response to current query demand. Queries can come
from one of two [query sources](#query-sources).
## Query sources
In Cortex XCOR, query demand comes from either an *automated* or a
*manual* source:
*Automated sources*, such as [monitors](/investigate/alerts/monitors) and
[recording rules](/control/shaping/shape-metrics/rules/recording) with regular evaluation
intervals, produce a relatively predictable demand on the query resources at the
database and at the browser.
Queries from an automated source often request a smaller set of data than something
like a dashboard query, but might incur high request volume. Although each individual
query is small, the amount of query resources they're demanding at regular intervals
is very large.
*Manual sources*, such as loading a dashboard, running a query in Metrics Explorer,
or making a direct API call, place demands on query resources at both the database
and browser that are cyclical or spiky.
Queries from a manual source are often exploratory, or retrieve longer time periods
than automated queries. The load these queries place on the system varies
significantly with the scale of data returned. Queries requesting more time series
and data points require more resources to retrieve information from the database, and
also can require more resources to deliver that information to the browser.
Individual queries of either type demand different query resources depending on the
amount of data retrieved from the database, amount of data returned the browser, or
both. For example:
* A query that places high load on the database but low load on the browser might
request the sum of a large set of data. The query retrieves all relevant data
points from the database (high database query load), but only returns a few summed
data points to the browser for a system's performance monitoring workflow.
* A query that places high load on both the database and browser might request the
raw, unaggregated data points from all services (many unique time series) to return
to the browser, such as for a debugging workflow.
### Automated source query limits
Cortex XCOR includes the
[Metrics Query Capacity Overview](/observe/dashboards/managed-dashboards#metrics-query-capacity-overview)
dashboard to measure your automated query consumption against system capacity. Use
this dashboard to understand how much query capacity remains as part of your budget.
The dashboard includes queries from monitors, recording rules, and service accounts
in the reporting metrics.
Cortex XCOR uses [selectors per second](#selectors-per-second) and
[data reads per second](#data-reads-per-second) metrics to track automated source
query limits. Exceeding either of these limits results in dropping data with an HTTP
`429 Too Many Requests` status code. Cortex XCOR continues dropping an
indiscriminate subset of incoming queries to keep query traffic within defined
limits.
To guard against prematurely dropping queries when unforeseen spikes occur,
Cortex XCOR doesn't start dropping data until either of the query limits
are exceeded for 10 minutes consecutively.
#### Selectors per second
These metrics track the count of selectors that queries issue per second. For
example, this metric includes a single selector named `up`:
```text theme={null}
up{app="webserver"}
```
A more complex query might include multiple selectors. The following query includes
two `sum` selectors:
```text wrap theme={null}
sum(rate(http_server_handled_total{status="200"}[2m]) / sum(rate(http_server_handled_total[2m]))
```
The Metrics Query Capacity dashboard displays the number of selectors consumed and
dropped against the limit per second. For more information about selectors, see the
[Prometheus documentation](https://prometheus.io/docs/prometheus/latest/querying/basics/#time-series-selectors).
The selectors per second query limit can't be increased.
To reduce query load for selectors per second, use the following strategies:
* Configure longer intervals for [monitors](/investigate/alerts/monitors) and
[recording rules](/control/shaping/shape-metrics/rules/recording).
For example, consider 1,000 monitor queries that include a single selector, each of
which runs every 15 seconds. These figures calculate to roughly 66 selectors per
second (`1000/15`). Increasing the execution interval to 60 seconds reduces the
number of selectors per second to roughly 16 (`1000/60`).
* Structure alert and monitor queries to use PromQL aggregations for optimal
efficiency. For example, you might create two separate alerts for service A and
service B error rates:
```text theme={null}
sum(rate(http_server_handled_total{service="A". status=~"5.*"}[1m])) > 10
sum(rate(http_server_handled_total{service="B". status=~"5.*"}[1m])) > 10
```
Instead, create a single monitor that checks both services:
```text wrap theme={null}
sum(rate(http_server_handled_total{service=~"A|B". status=~"5.*"}[1m])) by (service) > 10
```
#### Data reads per second
These metrics track the amount of raw data that Cortex XCOR fetched to run
the specified queries per second. Cortex XCOR calculates data consumed by
a query with this calculation:
```text /DATAPOINTS_RETURNED_FOR_SERIES/ theme={null}
READS = sum(DATAPOINTS_RETURNED_FOR_SERIES)
```
* `DATAPOINTS_RETURNED_FOR_SERIES` is the number of data points retrieved for query
execution.
This equation calculates the sum of all data points for a series, with a minimum of
60 data points per series. All smaller values are rounded up to `60`.
Consider a range query `sum(up{app="webserver"})` with a time range of
`[now()-1h, now()]`. If the query selects 10 steady series with a scrape interval of
30 seconds, the total number of retrieved data points is 1,200, as defined by this
equation:
```text theme={null}
READS = 10 * (1h/30s)
```
Next, consider an instant query `up{app="database"}` that selects 20 time series with
a scrape interval of one minute. Prometheus fetches five minutes of data by default,
so the resulting number of fetched data points is `100`, as defined by the following
equation.
However, this equation doesn't apply the minimum number of data points retrieved per
series, which is 60, so this equation isn't correct.
```text theme={null}
20 * 5 = 100
```
After applying the minimum number of data points retrieved per series, this rule
actually consumes 1,200 reads, as defined by this equation:
```text theme={null}
20 time series * 60 data points retrieved = 1200 reads
```
The following instant query is more advanced. This query requires Cortex XCOR to fetch
all data points for the selected series in a 30-day period, and
apply the minimum number (`60`) of data points retrieved per series.
```text theme={null}
sum_over_time(job_execution_errors[30d])
```
Queries that fetch [downsampled data](/control/shaping/shape-metrics/downsampling)
will consume less data reads because datapoint resolution for the selected series is
reduced, meaning less data points are used to process the query.
To reduce the consumption of data reads per second, use the following strategies:
* Write queries with a shorter time range or shorter range selectors.
* Create [rollup rules](/control/shaping/shape-metrics/rules/rollup) for unnecessary labels in your
most expensive queries to reduce the amount of data points the query needs to
fetch.
* Ensure that query selectors are as precise as possible, especially in join queries.
For example, consider this query:
```text wrap theme={null}
sum(rate(container_cpu_seconds{cluster="prod"}[1m]) by (node, container) / on (node) node_cpu_capacity
```
Including `{cluster="prod"}` in the latter part of the query reduces the number of
series and in turn data points the query needs to fetch for the right side of the
join. Use this instead:
```text wrap theme={null}
sum(rate(container_cpu_seconds{cluster="prod"}[1m]) by (node, container) / on (node) node_cpu_capacity{cluster="prod"}
```
## Optimize queries
Large queries might be good candidates for optimization by decreasing the amount of
data the query is trying to retrieve. Use the
[Metrics Query Capacity Overview](/observe/dashboards/managed-dashboards#metrics-query-capacity-overview)
to identify large queries.
Optimize queries by:
* Shortening the time window, or using [rollup rules](/control/shaping/shape-metrics/rules/rollup)
to decrease the data scale.
* Improving the query syntax by removing regular expressions to reduce the index
lookups performed by the query.
* Adjusting the number of concurrent unique requests in the system.
## Log query rate limits
When [querying log data](/investigate/querying/query-logs), be mindful of the
following limits that can impact your search experience, what happens if your tenant
exceeds limits, and how you can avoid hitting these limits.
* **Global query limit**: Each Cortex XCOR tenant has a global limit on
the total compute resources available for queries. If this limit is reached,
queries are queued and will run as soon as resources become available.
* **User query limit**: This limit prevents a single person from consuming all
available query resources. The user query limit is calculated based on the compute
resources required to run individual queries in addition to the number of user
queries that are run. Each user is limited to a percentage of the total available
query resources.
* **API query limit**: API queries are limited to a percentage of the total available
query resources.
### Avoid log query rate limits
If you experience slow or lagging queries on your log data, implement the following
changes to help increase the speed of your queries:
* Close unneeded tabs in your browser. Open tabs with long-running queries or that
refresh often, such as in Logs Explorer or in dashboards, consume more resources.
* Write efficient queries. Ensure your log queries are efficient so that they
complete faster and make resources available for other queries to run.
* Include the primary key in your query: Query on one of the predefined
[keys](/investigate/querying/query-logs/query-syntax#keys), such as `service` or
`severity`, and then use the
[query syntax](/investigate/querying/query-logs/query-syntax) to incorporate
additional attributes.
* Narrow the query scope. Reduce the time range or scope of your query to return
results faster.
## Query truncation at the browser
Cortex XCOR can truncate queries that return many unique time series or
data points to the browser to reduce the chances of long load times and query
timeouts. Truncating queries protects the browser from crashing when querying many
metrics. Dashboards and the Metrics Explorer both use query truncation.
Cortex XCOR calculates the browser limit using a combination of time
series, time granularity, and time period (and their resulting data points) requested
by the query.
The limits are:
* Time series a query can return to the browser: 2,500
* Data points a query can return to the browser: 300,000
The number of time series and data points returned to the browser might be the same
as the number requested from the database. If the query is doing some level of
aggregation, the number of time series and data points returned might be fewer than
what the query requests, but not greater.
To reduce the number of series returned to the browser, view the
[Aggregation Rules UI](/control/shaping/shape-metrics/reduce-cardinality/aggregation-rules)
to determine if a queryable aggregate metric already exists. If an aggregate metric
doesn't exist, use [aggregation rules](/control/shaping/shape-metrics/rules)
or [derived metrics](/investigate/querying/metrics/derived-telemetry/derived-metrics)
to:
* Query an aggregated subset of the raw data.
* Break the query into smaller chunks (by time, for instance) to reduce returned data
points.
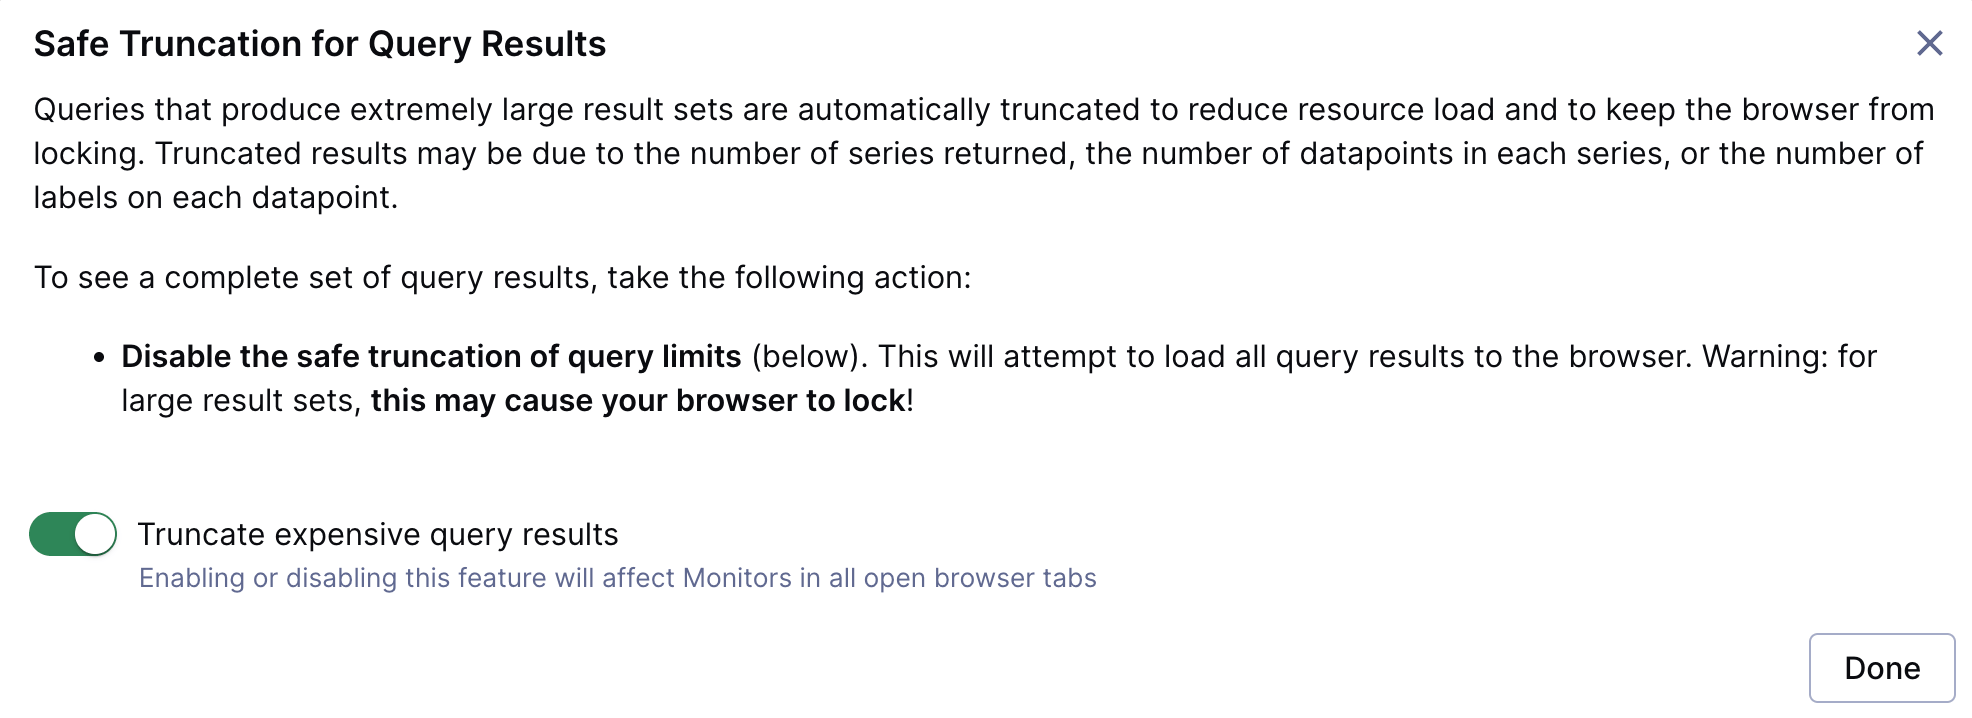
### Enable or disable query truncation
By default, Cortex XCOR enables query truncation.
To disable or re-enable query truncation:
1. In the displayed dialog, select **Options**.
2. Click the **Truncate expensive query results** toggle.
3. Click **Done**.
Disabling query truncation causes expensive queries to take longer to load and can
result in timeouts (no results returned for a single query), or might cause the
browser to crash.
 ## Query protections in the database
Cortex XCOR employs protections against very large queries in the database
layer, in addition to the browser.
A query that requests many unique time series or data points from the database
can experience these situations:
* Per-query scale protections
* Across-query resource balancing protections
* Individual query timeouts
These protections ensure a positive user experience for the maximum number of users.
A query requests resources from the database until it has the data it needs, or
until resources run out. Available resources can run out due to these reasons:
* Individual query scale protections are in place.
* There are many queries sharing scarce query resources (query balancing).
* An individual query reached a timeout.
### Query scale protections
Query scale protections ensure a positive user experience for the maximum number of
users. Current database query scale protections are:
* [Time series](https://prometheus.io/docs/concepts/data_model/#notation) a query
can retrieve: 300,000
* Standard data points a query can retrieve: 200,000,000
For Cortex XCOR
[histograms](/investigate/querying/promql/apply-functions#querying-histogram-metric-types),
the query limit depends on the number of buckets containing data within a
histogram.
The data points needed to satisfy the query's time requirement are calculated as:
```text wrap theme={null}
(Number of requested time series) * (Data resolution of the requested time series)
```
For example, a query does a sum of data points over two minutes, storing the
requested data with a 10-second resolution. That sum operation requires 12 data
points per time series, calculated as:
```text theme={null}
60s + 60s = 120s; 120s/10s resolution = 12 data points
```
If the query requests 20,000 time series, the number of data points is 240,000,
calculated as:
```text wrap theme={null}
20,000 time series * 12 data points per series for the 2 minute window
```
Dashboard queries request more data points because they use longer ranges. If the
previous example query is a dashboard query and the dashboard window is set to the
past one hour, the data points retrieved are calculated as:
```text theme={null}
60 minutes / 2 minute sum interval = 30 intervals
30 * 240,000 = 7,200,000 data points
```
Individual queries requesting more than the allowable limits will time out. Exceeding
query scale limits can produce one of the following error messages:
```text theme={null}
query processing would load too many samples into memory in decoding
```
```text theme={null}
The query exceeded the allowable resource limit.
```
These errors indicate that the query is trying to retrieve too many resources. Modify
the impacted query to reduce the scope and reduce the number of results being
fetched.
### Query resource balancing
Cortex XCOR tracks the number of concurrent queries received, the scale of
each query, and the unique users for each query. Cortex XCOR makes an
effort to fairly balance the available query resources between large and small
queries, and also between unique users.
If there are many concurrent queries, and each with relatively high scale, some
queries might need to complete in stages. This means that some queries must wait (be
throttled) to allow queries from other unique users to make use of the available
resources. The more unique users, the more balanced the system is in enabling
different queries to complete.
### Query timeouts
Even with balancing measures in place, if there are insufficient resources for a
query to complete within a specified time period, the query will time out.
Cortex XCOR displays an error message indicating the query timed out.
If a query times out, try these methods to resolve the issue:
* Modify the query syntax to retrieve less data per query. For example, try to
shorten the time range.
* Use shaping rules such as [aggregation rules](/control/shaping/shape-metrics/rules) to downsample
or roll up unnecessary labels, and then modify the query to retrieve aggregated
data points instead of the raw data points.
## Related topics
- [Cortex XCOR-managed dashboards](/observe/dashboards/managed-dashboards.md)
- [Find and fix rule and monitor evaluation failures](/control/shaping/shape-metrics/rules/evaluation-failures.md)
- [Log limits](/administer/limits-licensing/limits/log-limits.md)
- [Metric limits](/administer/limits-licensing/limits/metric-limits.md)
- [Licensing and system limits](/administer/limits-licensing.md)
This documentation is built and hosted on [Mintlify](https://mintlify.com), a developer documentation platform.
## Query protections in the database
Cortex XCOR employs protections against very large queries in the database
layer, in addition to the browser.
A query that requests many unique time series or data points from the database
can experience these situations:
* Per-query scale protections
* Across-query resource balancing protections
* Individual query timeouts
These protections ensure a positive user experience for the maximum number of users.
A query requests resources from the database until it has the data it needs, or
until resources run out. Available resources can run out due to these reasons:
* Individual query scale protections are in place.
* There are many queries sharing scarce query resources (query balancing).
* An individual query reached a timeout.
### Query scale protections
Query scale protections ensure a positive user experience for the maximum number of
users. Current database query scale protections are:
* [Time series](https://prometheus.io/docs/concepts/data_model/#notation) a query
can retrieve: 300,000
* Standard data points a query can retrieve: 200,000,000
For Cortex XCOR
[histograms](/investigate/querying/promql/apply-functions#querying-histogram-metric-types),
the query limit depends on the number of buckets containing data within a
histogram.
The data points needed to satisfy the query's time requirement are calculated as:
```text wrap theme={null}
(Number of requested time series) * (Data resolution of the requested time series)
```
For example, a query does a sum of data points over two minutes, storing the
requested data with a 10-second resolution. That sum operation requires 12 data
points per time series, calculated as:
```text theme={null}
60s + 60s = 120s; 120s/10s resolution = 12 data points
```
If the query requests 20,000 time series, the number of data points is 240,000,
calculated as:
```text wrap theme={null}
20,000 time series * 12 data points per series for the 2 minute window
```
Dashboard queries request more data points because they use longer ranges. If the
previous example query is a dashboard query and the dashboard window is set to the
past one hour, the data points retrieved are calculated as:
```text theme={null}
60 minutes / 2 minute sum interval = 30 intervals
30 * 240,000 = 7,200,000 data points
```
Individual queries requesting more than the allowable limits will time out. Exceeding
query scale limits can produce one of the following error messages:
```text theme={null}
query processing would load too many samples into memory in decoding
```
```text theme={null}
The query exceeded the allowable resource limit.
```
These errors indicate that the query is trying to retrieve too many resources. Modify
the impacted query to reduce the scope and reduce the number of results being
fetched.
### Query resource balancing
Cortex XCOR tracks the number of concurrent queries received, the scale of
each query, and the unique users for each query. Cortex XCOR makes an
effort to fairly balance the available query resources between large and small
queries, and also between unique users.
If there are many concurrent queries, and each with relatively high scale, some
queries might need to complete in stages. This means that some queries must wait (be
throttled) to allow queries from other unique users to make use of the available
resources. The more unique users, the more balanced the system is in enabling
different queries to complete.
### Query timeouts
Even with balancing measures in place, if there are insufficient resources for a
query to complete within a specified time period, the query will time out.
Cortex XCOR displays an error message indicating the query timed out.
If a query times out, try these methods to resolve the issue:
* Modify the query syntax to retrieve less data per query. For example, try to
shorten the time range.
* Use shaping rules such as [aggregation rules](/control/shaping/shape-metrics/rules) to downsample
or roll up unnecessary labels, and then modify the query to retrieve aggregated
data points instead of the raw data points.
## Related topics
- [Cortex XCOR-managed dashboards](/observe/dashboards/managed-dashboards.md)
- [Find and fix rule and monitor evaluation failures](/control/shaping/shape-metrics/rules/evaluation-failures.md)
- [Log limits](/administer/limits-licensing/limits/log-limits.md)
- [Metric limits](/administer/limits-licensing/limits/metric-limits.md)
- [Licensing and system limits](/administer/limits-licensing.md)
This documentation is built and hosted on [Mintlify](https://mintlify.com), a developer documentation platform.